Economic Affairs, Vol. 65, No. 1, pp. 17-22, March 2020
DOI: 10.30954/0424-2513.1.2020.3
©2020 EA. All rights reserved
Study of Non Timber Forest Products (NTFPS) in Meghalaya State of India: Methods for Empirical Analysis
Singyala Chiphang1, Ram Singh1* and S.M. Feroze2
1School of Social Science, College of Post-graduate Studies, CAU, Umiam-793103, Meghalaya, India
2College of Agriculture, CAU, Imphal, Manipur, India
*Corresponding author: ramsingh.cau@gmail.com ( ORCID ID: 0000-0003-0818-0168)
Received: 11-09-2019
Revised: 14-01-2020
Accepted: 26-02-2020
ABSTRACT
Non-timber forest products (NTFPs) income plays an important role in the household economy in the rural forest dwelling communities. The study utilised both the primary data and secondary data. Primary data were collected from 30 sample households from two villages in Ri-Bhoi district of Meghalaya to analysis the significant of NTFPs income in the rural household economy with the objectives, (i) To study the determinants of income generation through NTFP (ii) To estimate the extent of employment generation through NTFP (iii) Price behaviour of selected NTFP in Mawiong regulated market. Econometric model and Box-Jenkins Autoregressive moving average (ARIMA) methodology were applied for the study. The study found that income from business was the major income sources (45.74 % share to the total household income). Income from NTFPs collection has the second largest share with 22.05 per cent followed by crop production with 14.61 per cent, labour with 9.16 per cent and livestock with 8.44 per cent. The lin-log model was selected as best model based on the value of R2 value (0.89). Years of experience, total hours spent in NTFPs collection and average land holding have positive and significant relationship with the NTFPs income while age and distance travelled has a negative and significant association with it. Broom grass and Tezpatta contribute 2 and 1 manday/qtl/year to the total NTFPs employment. ARIMA (0, 1, 1) was the best fitted model as it has the lowest Akaike Information Criteria (AIC) and Bayesian Information Criteria (BIC). The price of Broom grass was forecasted for five weeks from 4th week of November to 4thweek of December 2018 using ARIMA (0, 1, 1). The forecast Broom grass price for 4th week of November to be ₹ 2891.66 /qtl which will decrease to ₹ 2687.46 in 4th week of December.
Hightlights
 Income from business was the major income sources followed by NTFPs collection and livestock
The lin-log model was selected as best model based on the value of R2 value
Broom grass and Tezpatta contribute 2 and 1 manday/qtl/year to the total NTFPs employment
ARIMA (0, 1, 1) was the best fitted model
Keywords: NTFP, Forest, Method, AIC and BIC
Non-timber Forest Products (NTFPs) are defined as biological material other than round wood or timber that may be extracted from natural ecosystems, natural forest plantations or in agro forestry systems used in household, marketed or has social-cultural or spiritual significance (FAO, 2001). NTFPs including all tangible products, natural, crafted or processed, derived from forests or any other land under similar use, other than timber. Non-timber forest products include products such as bark, roots, tubers, leaves, fruits, flowers, seeds, resins, honey, mushrooms, and fuel wood (Sunderland et al. 2003). Globally, more than two billion people are dwelling in forests, depending on forest resources for subsistence, income and livelihood security (Vantomme, 2003).
How to cite this article: Chiphang, S., Singh, R. and Feroze, S.M. (2020). Study of non timber forest products (NTFPS) in Meghalaya state of India: Methods for empirical analysis. Economic Affairs, 65(1): 17-22.
NTFPs are considered to be vital for sustaining rural livelihoods, reducing rural poverty, biodiversity conservation and facilitating rural economic growth (Maske et al. 2011). The NTFPs provide the products such as food, shelter, medicines, fibres, energy and cultural artefact for many of the world's poorest people and a considerable proportion of the less poor (Saha and Sundriyal, 2012). It also provides many households with a means of income generation, either as supplementary income to other livelihood activities, or as the primary means of cash generation (Mahapatra et al. 2005). According to World Resource Institute, over 500 million people in India are dependent on NTFPs for their subsistence and cash income (Sarmah and Arunachalam, 2011).
Several studies have highlighted the importance of NTFPs in livelihood activities. Pervaz (2002) observed that the NTFP generated maximum employment (60.72 %), followed by agriculture (22.30%), allied activities (15.83 %) and other sources (1.16 %). NTFPs like fuel-wood, medicinal plants, wild edible vegetables, house building materials etc are an integral part of day-to-day livelihood activities, especially for tribal people (Sarmah et al. 2006). The income from sale of the NTFPs for households living in and around forest constitutes 40 to 60 per cent of their total income (Nayak et al.2014). NTFP's play an important role in improving the livelihoods as well as meeting the needs especially for food, medicine, poverty reduction etc of the rural tribal communities particularly in the Paschim Medinipur district of West Bengal (Shit and Pati, 2012). Realising the importance of NTFPs, information regarding the prices of it must be known as it helps the farmers to plan the future farming activities, farm planning and budgeting. Modelling and forecasting of prices of agricultural commodities is essential for policymakers as well as for various stakeholders in the marketing chain of these commodities, right from farmers to consumers.
Assessing the quantity and value of NTFPs and transform their use from subsistence development by incorporating them into mainstream forest products such as timber. Yet, knowing the economic value of non-marketed NTFPs helps to give more accurate accounts of the total income of gatherers, as well as better estimates of the economic value of the forest. Forest development integrated with agricultural and industrial progress has great potential to enhance livelihood security, poverty reduction and food security for vulnerable section of society including illiterate, unskilled, resource- poor, jobless, and landless people in the area. Keeping the above facts in view, the present study has been undertaken to investigate the livelihood contributions of forest resources to the people in Meghalaya with the objectives, (i) To determine the determinants of NTFP income (ii) To estimate the extent of employment generation through NTFP (iii) To study the price behaviour of selected NTFP in Mawiong regulated Market.
Data and Methodology
Both primary and secondary data were used for the study. Primary data were collected from the field through structured schedule. The data collection pertains to quantity of NTFPs (Broom grass and Tezpatta) collected annually, total income obtained per year from NTFPs collection. Factor influencing collections in the study area were analysed using econometric model. Secondary data on prices of Broom grass were collected from AGMARKNET (www.agmarknet.gov.in). The weekly wholesale prices for Mawiong Regulated market was used to examined the pattern and behaviour of price movement for Broom grass. The data on wholesale weekly prices of Broom grass for the period of 11 months (January to November) were used to forecast the future price for 5 weeks. Box-Jenkins Autoregressive moving average (ARIMA) methodology (Box et al. 2007) using the SAS software package.
Analytical tools
Multiple regression model which is specified as:
Where, Y = the NTFPs income; X1 = Age (yrs); X2 = Year of Experience; X3 = Family Size; X4 = Distance Travelled (Km); X5 =Total Hours Spent in NTFPs Collection; X6 = Average land holding; X7 = Total income excluding NTFPs; u = stochastic disturbance term.
Box- Jenkins Autoregressive Integrated moving average (ARIMA) Model
ARIMA modelling is carried out in three stages, identification of the model, parameter estimation, diagnostic checking and forecasting. The identification step determines: (i) whether the process is stationary and the possible transformations to obtain stationarity; and (ii) whether the form of the process is autoregressive (AR), moving average (MA) or both (ARMA), and its order(s). Three parameters used in summarizing an ARIMA model are the AR parameter p, integration parameter d, and MA parameter q. Parameters p and q denote the order of AR and MA, while d denotes the degree of differencing the series to make it stationary. The autocorrelation (ACF) and partial autocorrelation functions (PACF) of a series together are the most powerful tool usually applied to reveal the correct values of the parameters. The ACF gives the autocorrelations calculated at lags 1, 2 and so on, while PACF gives the corresponding partial autocorrelations, controlling for autocorrelations at intervening lags. The final results included the parameter estimates, standard errors, estimate of residual variance, standard error of the estimate, natural log likelihood, Akaike's information criterion (AIC), and Bayesian Information criterion (BIC). Model selection was based on the minimization of AIC and SBC. These criteria are descriptors of the model's parsimony as they simultaneously account for the model's fit onto the observed series alongside number of parameters used in the fit.
The Autoregressive moving average (ARMA) model, denoted as ARMA (p,q), is given by,
Or equivalently by,
Where, B is the backshift operator defined by Byt = yt-i
A generalization of ARMA models which incorporates a wide class of nonstationary time- series is obtained by introducing "differencing" into the model. The simplest example of a nonstationary process which reduces to a stationary one after differencing is "Random Walk". A process {yt}} is said to follow Autoregressive integrated moving average (ARIMA),  denoted by ARIMA (p,d,q), if
The model is written as,
Where 𝛆t are identically and independently distributed as N (0,𝜎2). The integration parameter d is a non negative integer. When d = 0, the ARIMA (p,d,q) model reduces to ARMA (p,q) model.
Estimation of parameters for ARIMA model is generally done through nonlinear squares method. Among the competitive models the best models are selected based on minimum value of Akaike Information Criterion (AIC) or Bayesian Information Criterion (BIC) and for measuring the accuracy in fitted models, Mean Absolute Percentage Error (MAPE) were computed.
AIC = 2k – 2ln(L)
BIC = – 2ln(L) + kln(n)
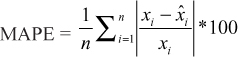
Where, Xi, xi are the value of the ith observation and estimated value of the ith observation of the variable X and k is the number of parameters in the statistical model, and L is the maximized value of the likelihood function for the estimated model.
RESULTS AND DISCUSSION
Determinants of NTFPs income
The local people in the study area depend on a number of income sources. Crop production, animal husbandry, forest product, off-farm activities are the main household's income sources. They combine the income from forest product with income from other farm and off-farm activities to improve their welfare. In the study area, NTFPs (Broom grass and tezpatta) are one of the most crucial sources of household annual income and this study supports the notion of high dependency of rural populations on the forest for their livelihood.
Table 1:OLS regression of NTFPs income against household socioeconomic variables
Variance Inflating Factor (VIF): X1=1.28, X2=1.99, X3=1.38, X4= 1.32, X5=2.19, X6= 1.19 and X7=1.67
Note: Figures in the parenthesis indicate the p value
***significant at 1%; **significant at 5%; *significant at 10%.
Lin-log Model
Y = 5123.75 + ln (-16160.52X1) + ln (19815.61X2) + ln (-79.87X3) + ln (-7744.85X4) + ln (48237.81X5) + ln (5381.79X6) + ln (-412.31X7)
The lin-log model was selected as best model based on the value of R2 value (0.891). As indicated in Table 1, years of experience (X2), total hours spent in NTFPs collection (X5) and average land holding (X7) have positive and significant relationship with the NTFPs income while age (X1) and distance travelled (X4) has a negative and significant association with it (Table 1). Similar finding was put forth by Opeluwa et al. (2011) stating that the distance separating the households to the source of NTFPs negatively affected their decision to collect NTFPs.
Extent of employment generation through NTFP
Broom grass was the major employment source contributing 55% (2 mandays/qnt/year) to the total NTFPs employment. Tezpatta was the next important employment generating activity which provides 44% (1 mandays/qtl/year) to the total NTFPs employment (Table 2).
Table 2: Contribution of NTFPs in employment generation
Note: figures in the parentheses indicates the percentage.
Price behaviour of the selected NTFP
ARIMA model is estimated only after transforming the variable under forecasting into a stationary series. The stationary series is the one whose values vary over time only around a constant mean and constant variance. There are several ways to ascertain this. The most common method is to check stationarity through examining the graph or time plot of the data.
Visual Inspection for stationarity
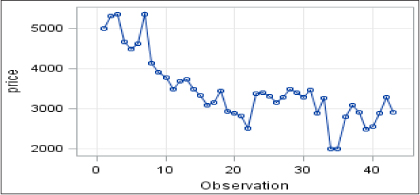
Fig. 1: Weekly average prices from January to November 2018
Fig. 1 revealed that the data was nonstationary. Nonstationarity in mean is corrected through appropriate differencing of the data.
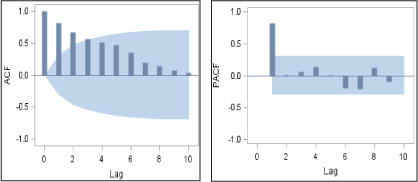
Fig. 2: ACF and PACF of the series
Autocorrelation check for White Noise
H0:: Series is stationary
In this case the white noise hypothesis is rejected based on autocorrelation test, this is expected as the series is non stationary. The p value for the test is printed as ˂ 0.0001 which significantly rules out the assumption of stationary series (Table 3).
Table 3: Autocorrelation check for White Noise
Trend analysis after differencing
Fig. 3: Weekly average prices from January to November 2018 after differencing
The newly constructed variable Yt was stationary in mean, the next step is to identify the values of p and q. For this Autocorrelation (ACF) and Partial Atocorrelation (PACF) of various orders of Yt were presented in Fig. 4.
Fig. 4: ACF and PACF of differenced series
Autocorrelation check for White Noise
H0:: Series is stationary
In this case the white noise hypothesis is accepted based on autocorrelation test. The p value for the test is not significant.
Table 4: Autocorrelation check for White Noise of differenced series
Model selection criterion
The various ARIMA models were fitted. The model which had minimum AIC and BIC value was chosen. The various ARIMA models and their AIC and BIC values are presented in Table 5 indicating that ARIMA (0, 1, 1) has the lowest AIC and BIC value.
Table 5: AIC and BIC value of ARIMA
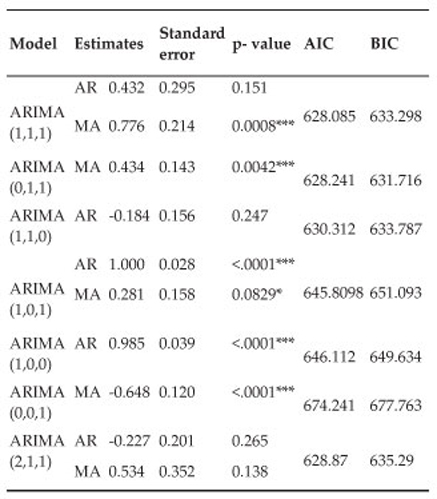
The value of the AIC and BIC was lowest and worked out to be 628.241 and 631.716 for the ARIMA (0,1,1) and the MAPE value recorded to 6.13, indicated that ARIMA (0,1,1) was the most suitable model for forecasting Broom grass prices.
Validation of ARIMA (0, 1, 1)
To judge the forecasting ability of the fitted ARIMA model, important measures of the sample period forecasts accuracy were computed. The Mean Absolute Percentage Error (MAPE) for Broom grass prices worked out to be 6.13. Table 6 indicates that the forecasting inaccuracy is low.
Table 6: Mean Absolute Percentage Error (MAPE)
ARIMA forecasting
From the table 7 it was observed that the forecasted weekly prices of Broom grass from 4th week November, 2018 was ₹ 2891.66 /qtl which will decrease to ₹ 2687.46 in 4th week of December.
Table 7: Price Forecast of Broom grass (₹/qtl) for fitted ARIMA (0, 1, 1) model
CONCLUSION
The paper is based on a comprehensive data set collected from 30 households from the Ri- Bhoi district of Meghalaya. The study concluded that major sources of income include income from business, NTFPs followed by crop production. The lin-log model was selected as best model based on the value of R2 value (0.89). Years of experience, total hours spent in NTFPs collection and average land holding have positive and significant relationship with the NTFPs income while age and distance travelled has a negative and significant association with it. Broomgrass and Tezpatta contribute 2 and 1 manday/qtl/year to the total NTFPs employment. The study has revealed that the ARIMA model being stochastic in nature could be used successfully for modelling as well as forecasting of weekly prices. ARIMA (0, 1, 1) was selected as the best fitted model and the forecast Broom grass price for 4th week of November to be ₹ 2891.66 /qtl which will decrease to ₹ 2687.46 in 4th week of December.
REFERENCES
Box, G.E.P., Jenkins, G.M. and Reinsel, G.C. 2007. Time-Series Analysis: Forecasting and Control. 3rd edn. Pearson education, India.
FAO. 2001. State of the World's Forest. Rome, Italy, pp. 295.
http://agmarknet.gov.in. Directorate of Marketing and Inspection, Ministry of Agriculture and Farmers Welfare, Government of India. Accessed on 15th November 2018.
Mahapatra, A. 1992. Forest dwellers dependence on forest - A case study of Pauri Bhuinya tribe of Orissa. Journal of Rural Development, 11(6): 863-872.
Maske, M., Mungole, A., Kamble, R., Chaturvedi, A. and Chaturvedi, A. 2011. Impact of non-timber forest produces (NTFPs) on rural tribes' economy in Gondia district of Maharashtra, India. Achieves of Applied Science Research,3(30): 109-114.
Nayak, B.P., Kohli, P. and Sharma, J.V. 2014. Livelihood of local communities and forest degradation in India: Issues for REDD+. Tata Energy and Resources Institute (TERI), New Delhi, India, pp. 5.
Pervez, M.S. 2002. Role of non-timber forest products in the economy of dwelling households of Dhading district, Nepal: An Economic Analysis, MSc thesis, University of Agricultural sciences, Bangalore, Karnataka.
Saha, D. and Sundriyal, R.C. 2012. Utilization of non-timber forest products in humid tropics: Implications for management and livelihood. Forest Policy and Economic,14: 28-40.
Sarmah, R., Arunachalam, A., Majumder, M., Melkania, U. and Adhikari, D. 2006. Ethno-medico-botany of Chakmas in Arunachal Pradesh, India. The Indian Forester, 132: 474-484.
Sarmah, R. and Arunachalam, A. 2011. Contribution of nontimber forest products (NTFPs) to livelihood economy of people living in forest fringes in Changlang district of Arunachal Pradesh, India. Indian Journal of Fundamental and Applied Life Science, 1(2): 157-169.
Shit, P.K. and Pati, C.K. 2012. Non-Timber Forest Products for Livelihood Security of Tribal Communities: A Case Study in Paschim Medinipur District, West Bengal. Journal Human Ecology, 40(2): 149-156.
Sunderland, T., Besong S. and Ayeni, J. 2003. Distribution, Utilization and Sustainability of Non-timber Forest Products from Takamanda Forest Reserve, Cameroon. Smithsonian Institute/MAB Biodiversity Program, Series 8. Washington D.C., USA.
Vantomme. 2003. Forest Products Division, Forestry Department, FAO, Rome.